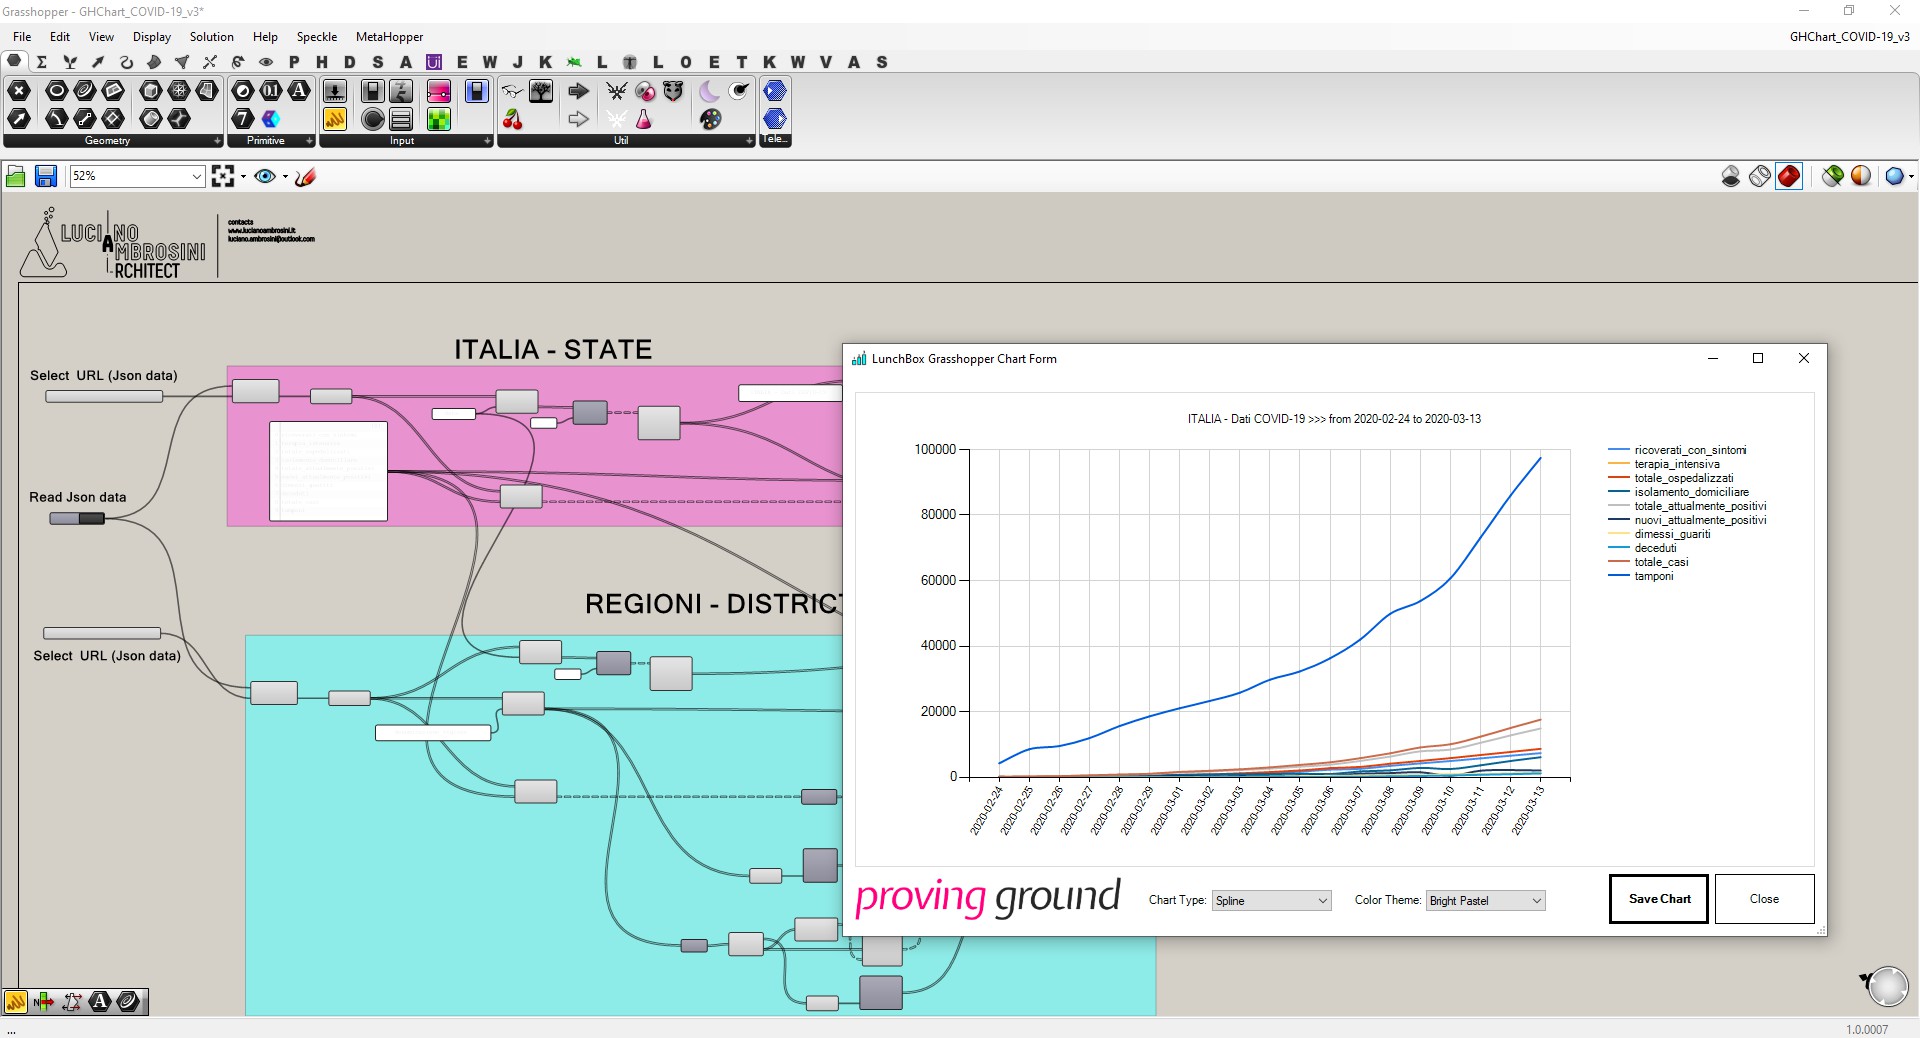
A simple algorithm to track the virus situation in Italy (a Grasshopper user PoV). The algorithm shows the data collected by the Protezione Civile and stored at the following link: https://github.com/pcm-dpc/COVID-19
In any case, I invite anyone interested to consult the official sources (HERE) to avoid inaccuracies. There is also an official dashboard (HERE).
Below the graphs in real-time of the national and regional COVID-19 trend (read the header at the top of the graph – data on this website will be updated every day by me simply run the algorithm)
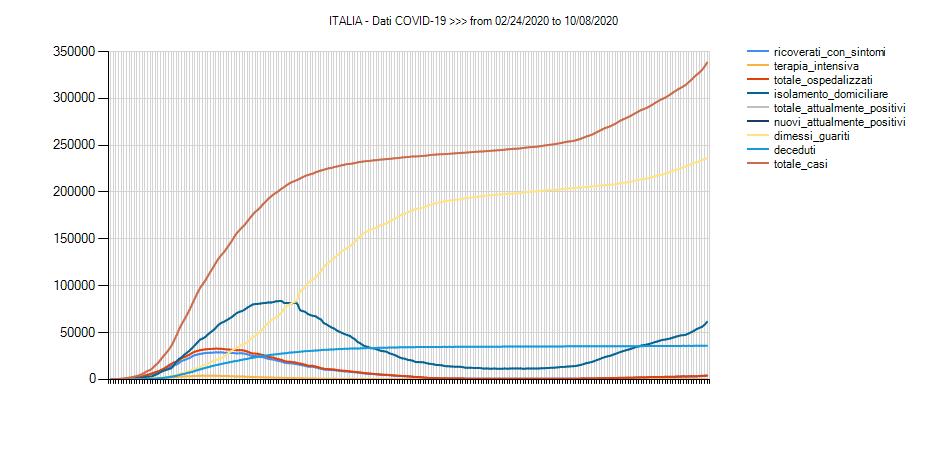 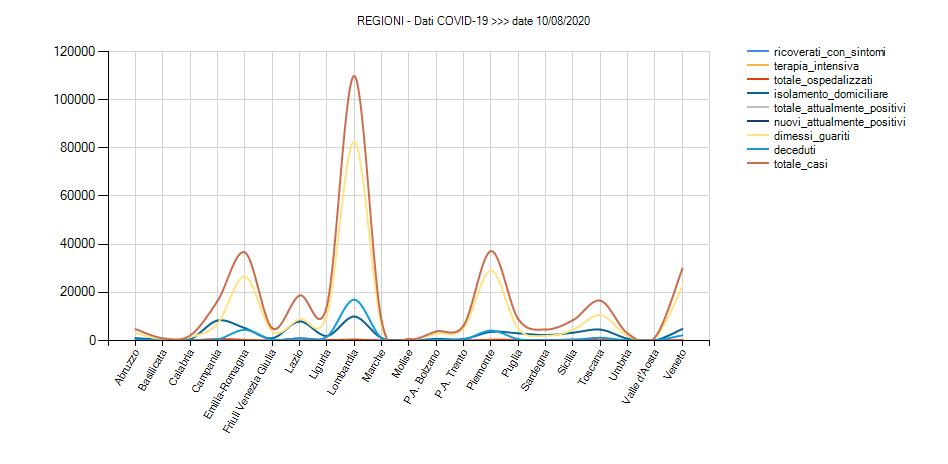 |
To take into account this time tweaking a little bit with JSON data from linked URL…then visualizing these data by Day and Regione (district). When the data is updated, the graph will also update automatically. Below a demonstration video (right charts above).
A big hug to All of us! #iorestoacasa